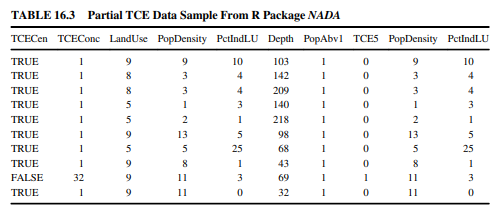
A data sample is available in R consisting of groundwater trichloroethylene (TCE) contaminant concentrations as the response or Y variable and predictor or X variables that include type of land use, population density (PopDensity) in the surrounding area, percentage of land use associated with industrial activity (PctIndLU), and Depth to groundwater. A binary logistic regression is to be computed for predicting the probability of detecting TCE concentration at or above the maximum laboratory reporting limit of 5 μg/l, as a function of PopDensity and PctIndLU. To access the 247-value data sample, first install the NADA package in R as described in Example 12.4, Section 12.7. Then type the following scripts in three separate lines (but do not include the semi-colon or period): library(NADA); data(TCEReg): TCEReg. A partial listing of the data sample is shown in the left panel of Table 16.3.
Our Y variable for the logistic regression is the binary categorical variable, TCE5 shown in the right side of Table 16.3, which we assign a value of 1 if the concentration (represented by the variable TCEConc) is equal to or higher than 5 (where a TCE concentration equal to or higher than 5 is regarded as “success”), and a value of 0 if the TCE concentration is lower than 5 μg/l (i.e., “failure”). If a TCE concentration hasa TCECen value of “TRUE,” it indicates that it is a censored value, that is, a NonDetect (ND) value. For instance, the first 8 TCE concentrations (TCEConc) are all equal to 1 but are all censored, meaning that 1 is merely the reporting limit (see Chapter 3 for reporting limits and NDs); hence the TCE5 value for all the 8 observations is 0 because none of the TCE concentration values is greater than 5. In contrast, the TCE concentration of 32 is an actual detected value and is also greater than 5; hence its TCE5 value is 1. Note that a TCE concentration of 5 will be coded as 0 (i.e., will have a TCE5 value of 0) if it has a TCECen value of “TRUE” (i.e., if it is a ND), and coded as 1 if it has a TCECen value of “FALSE” (i.e., if it is an actual detected value). Also note that of the 247 observations in the data sample, 30 have TCE concentration equal to or higher than 5 (i.e., have a TCE5 value of 1). (A) Based on the generalized linear model (GLM) as described in Section 13.3.5, compute the logistic regression of TCE5 versus PopDensity and PctIndLU using the following script (where TCEReg.dat is the input data file name):